

The yield curve is a curve on a graph in which the yield of fixed-interest securities is plotted against the length of time they have to run to maturity. A yield curve is almost always upward sloping, a sign that the economy is functioning properly.
To best understand the yield curve, put yourself in the shoes of the lender, the borrower, and the investor. Each entity is rational and looking to do what's best for their bottom line.
In this post, we'll look and the yield curve in the past several years. We'll then discuss how the yield curve acts as a good economic indicator for the future.
Lender's Perspective Of The Yield Curve
Due to inflation, the value of a dollar tomorrow is worth less than the value of a dollar today. Therefore, in order to profitably lend money, you must charge an interest rate. The longer the lending term, the higher the interest you should charge, hence the upward slope of the yield curve.
Let's say the borrower has a poor credit score and runs an unstable business. Or maybe the borrower has large job gaps in his resume or doesn't have many assets. If this is the case, you need to charge an even higher rate to account for credit risk. In the situation where the borrower pays back an interest rate higher than your competition, you're making superior economic returns.
As a bank, your main source of funding is from saving deposits. For the privilege of holding such deposits, you pay customers an interest rate and hope to lend out their deposits at a higher interest rate for a positive net interest margin. If the yield curve is upward sloping, banks have an easier time achieving such profitability.
If the yield curve is inverted, a bank gets in trouble when it “borrows short and lends long” like Silicon Valley Bank. Silicon Valley Bank bought long-duration Treasury bonds that yielded less than 1.7%, while its cost of deposits grew to over 4% as the Fed hiked rates. After selling its long-bond portfolio and losing $1.8 billion, a bank run ensued, threatening the entire economy.
Borrower's Perspective For The Yield Curve
A rational borrower is incentivized to: 1) borrow as much money, 2) for as long a period of time, 3) at the lowest interest rate possible to get rich. The more you borrow, the more you will likely invest. When the borrowing rate is equal to or below the inflation rate, a borrower is essentially getting a free loan.
The classic borrower example is the homebuyer. After putting down 20%, the buyer borrows the remaining 80%. The lower the interest rate, the more inclined the borrower is to take on more debt to buy a bigger, fancier house.
When homebuyers want to stretch, they take out short-term adjustable rate mortgages (ARM) with lower interest rates versus 30-year fixed loans with higher rates. In a declining interest rate environment, taking out an ARM is an optimal move.
In addition to homebuyers, there are companies large and small, that borrow money to grow their respective businesses. If interest rates are lower at every duration, businesses will tend to borrow more, invest more, hire more, and consequently boost GDP growth.
The Investment part of the GDP equation: Y = Consumer Spending + Investment + Government Spending + Net Exports is vital.
Investor's Perspective For The Yield Curve
Given the motivations of the borrower and the lender, the investor sees the yield curve as an economic indicator. The steeper the yield curve up to a point, the healthier the economy. The flatter the yield curve, the more cause for concern given the borrower's doubt about the near future.
If there is a lack of demand for short-term bonds, pushing short-term yields higher, perhaps there is doubt about short-term economic growth. Similarly, if investor demand for long-term bonds keeps long-term yields low, this may mean investors don't believe there are inflationary pressures because the economy isn't viewed as trending stronger.
Short-term yields are also artificially pushed up by the Federal Reserve since the Fed Funds rate is the overnight lending rate – the shortest of the short. An investor needs to make a calculated guess as to how often and how aggressively the Federal Reserve will raise its Fed Funds rate and how the bond market will react to such moves.
The bond investor wins if inflation comes in below expectations. Inflation comes in below expectations when economic growth comes in below expectations.
The stock investor wins if economic growth comes in above expectations, generating stronger corporate earnings growth, while interest rates remain at a level high enough to contain faster-than-expected inflation while not choking off investment growth.
In the case of Silicon Valley Bank, it lost big time because it borrowed short and lent long. In other words, it bought 10-year Treasury bonds yielding 1.7% and had to pay depositors 4%. An inverted yield curve is a disaster for SVB, and a bank run ensued.
Why A Flattening Yield Curve Is A Warning Sign
Take a look at the yield curve from 2019 versus the yield curve from 2018. As you can see from the chart below, the yield curve is now inverted with 1-month, 3-month, and 6-month treasuries yield more than 1-year, 2-year, 3-year, 5-year, 7-year, and 10-year treasuries.

Now let's take a look at the yield curve from January and February of 2020. With coronavirus fears shutting down world economies, investors are aggressively buying up bonds for safety. In the beginning of 2020, the stock market posted two back-to-back 3% declines.
2020 Yield Curve Graph
Then, of course, the stock market crashed by 32% in March 2020. One could say the yield curve helped predict the crash. A flat or inverted yield curve at least gave us some ample warning signs.

With a flat or inverted yield curve, you are disinclined to lend money over a long duration because the return is too low relative to the short-end. As a result, you tighten up lending standards and lend to only the most creditworthy people.
You'd rather lend money for as short a time as possible because the interest rate you can receive is similar to the long-end. A shorter lending time horizon is also less risky than a longer time horizon.
Upward-Sloping Yield Curve Examples
Below is the yield curve for 2021, 2020, and 2019. An upward sloping yield curve is a bullish indicator. It shows the economy is functioning normally as longer-dated money costs more to borrow.

How Borrowers Think During A Flat Or Inverted Yield Curve
Unfortunately, borrowers think exactly the opposite. Borrowers are less inclined to borrow capital short-term if the interest rate is very similar to long-term interest rates. They'd rather borrow at the same rate for a longer time period, but are often shut out due to more stringent lending standards.
When the yield curve inverts, i.e. when short-term interest rates are higher than long-term interest rates, the rational borrower slows or stops his borrowing. Only the most desperate (least creditworthy) borrower takes out a short-term loan at a higher interest rate (e.g. credit card and loan shark borrowers).
This ultimately ends up hurting both the lender and the economy long-term due to higher default rates. A cascade of defaults by overstretched mortgage debtors is exactly what took the housing market down between 2007-2010.
There will eventually be an interest rate inflection point where the borrower not only stops borrowing, but starts saving more. With borrowers saving more, investment, by definition slows down. Multiply this action across millions of people throughout the country and the economy will turn south.

This Time Is Probably NOT Different
In economics and finance, everything is rational long term. Investors take action to enrich themselves, while doing their best to avoid actions that will make them poor.
Take a look at the chart above. Within a couple years of the yield curve inverting (yellow), a recession ensued. Each time a recession ensued, the stock market took a dive.
The tricky part is not forecasting if a recession will happen once the yield curve inverts. The tricky part is forecasting when the recession will happen.
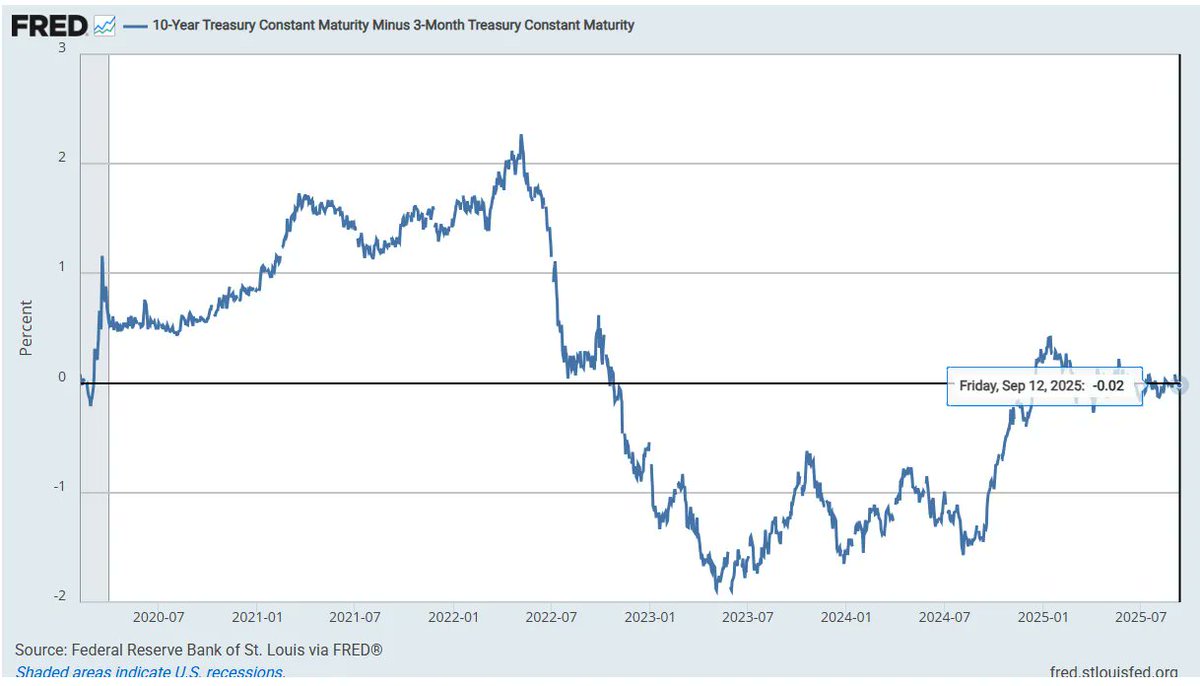
In 2023, the yield curve went extremely inverted. In fact, the yield curve was the most inverted its been since 1981. After a record-long inversion, the yield curve finally stopped its inversion in September 2024.
Today, the Fed started cutting rates in September 2024, took a 9-month pause, and will likely keep on cutting in September 2025, especially with rising fears of a recession under Trump. As a result, the short end of the curve will keep going lower, which should create an upward sloping yield curve.
Here's another great chart highlighting the yield curve, recessions, and the S&P 500. So far, the S&P 500 is in bull market territory in 2024. However, caution is advised. Here's how I'd invest $250,000 today. It provides a sensible way to invest your money while taking advantage of rates.

Invest In Commercial Real Estate To Benefit From The Upswing
With mortgage rates declining and the Fed embarking on a multi-year interest rate cut cycle, investing in real estate is an attractive proposition. More capital will begin to rotate out of volatile stocks and into real estate, an asset that provides utility and generates rent.
Take a look at real estate crowdfunding to find value in the heartland of America where valuations are cheaper and net rental yields are higher. Fundrise is the top real estate crowdfunding platform today. Fundrise manages over $3 billion and has over 380,000 investors in the Sunbelt region.
I've personally invested over $400,000 in Fundrise to diversify my expensive SF real estate holdings and invest in venture capital. Commercial real estate has bottomed out and I expect there to be a rebound over the coming years.

Here's the latest conversation I had with Ben Miller, CEO of Fundrise on his outlook for commercial real estate in 2026 and beyond.
Understanding The Yield Curve As A Prescient Economic Indicator is a FS original post.
Great article. I have two questions
1) Why get an ARM in a situation where the interest rate is so low? Doesn’t it have to go up from here?
2) Doesn’t refinancing reamortize the mortgage, meaning I am back to paying mostly interest, even though I have a a lower rate?
We are at 3.975% in a 30 year fixed. Why would I reset my mortgage and take on the risk of rising interest rates with an ARM? Seems like a wash at best and paying more interest at worst. Appreciate your further insights.
Sure, check out this article. https://www.financialsamurai.com/30-year-fixed-mortgage-loan-vs-adjustable-rate-mortgage-arm-the-choice-is-obvious/
Why pay more interest expense than you have to?
After you refinance, I’d continue to pay down extra principle.
People with 30 year fixed rate mortgages have overpaid for the past 35 years and counting.
First time poster here, I recently discovered your blog and have been gobbling up all the information. I really like the way you simplify things so a non-financial reader like me can grasp it.
Now to my question, I have been wrestling with this decision for a while now and any insight would help. We live in south bay, Milpitas specifically. We own a town home as our primary residence and the property value has almost doubled since I bought it in 2010 (~500K in gains, right at the limit of tax free capital gains). I see a lot of condos and town homes popping up everywhere (few thousand units in the last few years and still more construction ongoing), but I also see the area growing with the BART stations, new schools and shopping malls.
We eventually want to own a single family home with a yard for our kids and we can afford a comfortable mortgage (3-5X the gross earnings) without selling our current residence. How do I go about analyzing the following scenarios,
1) Sell the primary residence at the current highs, rent until the market cools down and buy a single family home.
2) Stay in the current primary residence until the market cools down, buy a single family home and make the current residence as a rental property.
The X factors are, if I sell the house now, I`m not sure how long I will need to rent. Also my HOA came up with a recent assessment of $25K/unit for fixing some exterior stuff (which is not much in long run).
I bought a house in 2007 with a 30-year fixed mortgage. I later refinanced in 2009. In 2012 I refinanced again with a 5/1 arm at 3. 0%. I sold that house in 2013 to move to Florida for a new job. I bought a house in 2014 there with a 5/1 ARM 3%. As I’ve mentioned in other comments, my job forced me to move and I sold that house in 2016 and bought my current house with a 5/1 ARM at 3%. I am now nervous with interest rates going up whether I should have just done 3 7/8, 30 year instead of 5/1 ARM at 3%. But I still have two and a half more years before the rates would go up. Any comments Sam? You seem still more encouraging on the adjustable rate
I think you’ll still come out ahead with a 5/1 ARM. I don’t see the long bond yield going up much more than 0.5%, hence the flattening yield curve.
I’m assuming you have more money now than then, too.
Aaah, thanks for reminding me of the big picture. I was thinking of monthly payment going up, but you’re right, look at it all. Since that day in Feb 2016 that I closed on current house (when I had to pull downpayment out of the market at a loss due to the low point then), my total investments have doubled. Most of that is investment earnings or deposits I made since then, and 15% of my current worth is from money on the house I sold in Florida that came in Apr 2016 (and unfotunately, which I didn’t invest that well, but it’s made some money).
Sam-great post. Question: come next April 15, what impact will the loss of the SALT deduction have on coastal real estate and economies? I think it may be what helps trigger local and then national slowdown. But for some reason the media has paid no attention to what I believe will be a shock to many blue state homeowners and a corresponding shock to the real estate market and economy.
I definitely think next year’s taxes will be a big shock to coastal city residents. Nobody really feels anything until that happens, because people don’t properly plan.
The shark is one of the main reasons why decided to sell one of my rentals and diversify into the heartland of America. https://www.financialsamurai.com/focus-on-investment-trends-why-im-investing-in-the-heartland-of-america/
I think there there is a case to be made why this time things may be different. When you look at the long end up the yield curve it’s effectively pegged to the 10Y UST. The reason I think things are different this time around, is what’s keeping the long end down. It’s not the expectation that there will be a large abrupt dislocation in the market, or that the economy will stop growing, or that inflation will be zero. It’s down because the world is buying up bidding up treasuries on the secondary.
The problem as I see it is that the major economies of the world are still pursuing a quantitative easing policy. The Japanese and the Europeans are still dovish. On a risk adjusted basis, the UST offers superior returns to any other sovereign. Japanese yields have been hovering around 0 for last 2 decades. As for Europe, Bunds are at negative to zero on one end of the credit spectrum and on the other end Greek debt is tightened to around ~3.8%. With the 10Y UST at floating between 2.8%-2.9% it’s one of the best deals out there. If you wanted to buy full faith and credit, there is really only one place to put your money. If you want further indirect evidence just look at the exchange rates. The dollar is just getting stronger as people keep bidding up the USD to buy USD assets. Just my two cents.
Hence why the long-bond will stay low IMO since we are a relatively good deal globally.
But, eventually, when the spread between US yields and global yields widen too much, we will be at a tremendous disadvantage and become uncompetitive. Then the Net Export part of the GDP equation suffers, and so will the other variables until Government Spending gets pumped up again.
The problem is that US yield have been trying ratchet up, but they keep getting hammered down because as the spread widen more market participants in a yield starved market step in. the 10y UST hit 3.1 not too long ago. I think until the world starts pursuing a tighter policy, the long end will continue to remain low. While I understand that the (ex-im) part of the equation will suffer, with the foreign capital inflows due to a stronger dollar, will drive the the I higher, and the strong demand for UST will allow the government to boost the G, and all this together will boost the C. The theory is that we might export less, but our government will be able to spend more, and companies will be able to invest more, and consumer spending will rise as a result, TL:DR C+I+G will be greater than the delta of (Ex-Im)
What you describe is a vector in the markets, but there’s also de-dollarization occurring as well.
Ever since the eurodollar markets broke in 2007, the SCO bloc has been busy cobbling together an alternative financial system. The fact Russia has dropped the list of top foreign holders of UST’s is a big tell in my opinion. And come September the first if the Shanghai oil contracts are to be settled. The volume on the Shanghai Energy Exchange has far exceeded my expectations. I thought it would take more time to get to where it’s at now.
To make sense of what Trump is doing all you have to do is look thru the lens of extracting America from the burden of issuing the global currency. The military/intelligence faction behind Trump wants to take the country where JFK wanted.
I think de-dollarization of the world it not practical or beneficial for anyone at the moment. Things can change but if you think through the most fundamental thing that needs to happen it becomes come more and more remote. To de-dollarize, you need to find another currency that will be universally accepted. The next best thing is the Euro which is a very carefully managed currency and even the Euro has doubters amongst the European nations that use it. In my previous life, I structured numerous fixed income transaction denominated in EUR and GBP, and all of them contain a clause to contemplate the possibility that the EUR and GBP will ceases to exist at any point before the termination of the transaction. Once you leave the euro and sterling, your runner ups are the CNY, RUB and JPY. None of those are ideal currencies for use in global trade. At the end of the day, the position of global currency will be held by the nation that has the strongest economy,the strongest military and the the most stable government.
Of course history has taught me the status of being a global currency is impermanent. There was a time when Spain and Portugal were both the global currency. So I don’t disagree that the world is trying to de-dollarize, its just that i don’t see it happening anytime soon.
Hi Sam,
Great post, and like a few others have mentioned, this is the first breakdown of the yield curve that I have actually grasped. However, what is your opinion on the fed discarding the yield curve as a predictor of a recession based on their last meeting? Here is an article describing why the fed doesn’t think the yield curve is no longer a good predictor of an upcoming recession. Can you please let us know what you think of this?
nakedcapitalism.com/2018/07/yield-curve-flattens-threatens-invert-fed-discards-recession-indicator.html
Thanks!
The Fed uses moral suasion. They can’t telegraph exactly what they think, otherwise, markets will arbitrage immediately with often violent results.
Why do you think nobody could fully comprehend what Alan Greenspan was saying?
Wow Sam this blog is real and timely. Thanks! What’s your expected drop in 2019?
It’s true we’ve been drunk in cheap credits, both short term thru Fed engineering, and long term thru Fed QE2 and China buying our long bonds. Since both sources are drying up now, it looks like not only yield curve is flattening, but also going up on both short and long end.
This past week we looked at a few SF real-estates as potential investments, current prices can no longer justify given the rental incomes. i.e. cap rate is much lower than mortgage interests + HOA + property tax (even if financing is only 80%, not 100% we’d have negative carry). 1-bedroom condos prices are dropping because it’s primarily an investor market. Current price level only makes sense for people who want to live in SF for 5-7 years, so their ownership cost is lower than rent only because tax deductions.
In outer markets like east bay, the rent is dropping, which is alarming because normally the job market should keep the rent stable, but thanks for over-building and soft job markets we’re not able to raise rents without losing tenants.
But is the current yield curve indicative of a severe recession, or a mild one? In 2008 the real culprit was sub-prime lending and resulted in a huge recession. In 2000 there was dotcom bubble. This time there’s no bubble (or I failed to see one?) Maybe the high flying stocks and real-estate will flatten or drop 10-20%, but consider S&P went down 40% during 2008, maybe a 10-20% correction wouldn’t be so bad?
Not sure. For the SF Bay Area economy, I see a mild recession with corrections in the 15% – 20% range. For outer lying areas, 30% – 40%. Our economy has so many massive companies with huge balance sheets. Hard to see a hard landing.
But property prices and rents are definitely weakening. It is obvious for anybody looking and searching. It’s weird why the media doesn’t highlight this more, and just highlights more hype.
This is an excellent commentary.
Anybody have an opinion of this Qanon? I’m torn. I can’t tell if it’s for real or a bunch of internet opportunists trying to monetize on the Fourth Turning.
I love your crazy comments. They are so enlightening and strange because they literally make no sense and have no point. Keep it up!
Boo-yah
I was in business school in early 2008 and taking a course by famed economist/professor Zvi Bodie who was explaining this concept. At the time, it seemed obvious what would be the trigger (a slowdown or collapse in housing), even though the exact way it happened (Bear, Lehmen, Default Swaps) wasn’t.
I’m not sure what’s going to cause the next recession? I don’t see anything on the horizon. Could be the case that to have the tools in-place to fight the next major recession, the Fed has to effectively “cause” a mini-recession with the rate hikes and asset unwindings. That’s all I can think of.
As Luke Gromen says after the dotcom crash the risk was moved onto bank balance sheets. After the mortgage implosion the risk was moved onto the sovereign balance sheets. Now here we are with the Everything Bubble across the globe. What will be the release valve this time?…Fiat Currencies with a writedown of sovereign debt..
My bet for the catalysts is housing + student debt.
Here’s a good article on the slowdown in global real estate: https://www.peakprosperity.com/blog/114196/trouble-ahead-housing-market
It’s been obvious to anybody on the ground looking. I just wonder if the mass media will truly highlight the obvious.
Great job breaking down the curve in a way that everyone can understand!
I’m skeptical that this correction/recession will look the same as the last two. My warning bells are ringing because it seems like a lot of people have the playbook for getting out before the market corrects. A lot of “market does not top until 12-18 months past a yield curve inversion”, with everyone eyeing the same cash markets. However, if you look at the forward markets you will see that OIS, Eurodollar, and global bond indexes have already inverted.
We’re also coming from very different stimulus/liquidity levels than the last time. The neutral rate is probably closer to 2.5-3% rather than 5+%. The Fed has less ammo to delay once the data and curve signal a warning. We also have had unprecedented liquidity injections globally over the last decade. Who knows exactly how balance sheet tightening will factor into the cycle. What impact could a trade war escalation have on that timeline now that Yuan devaluation and/or foreign treasury dumping could be in play?
It’s possible we see the same pattern of curve inversion, 12-18 months later equities top, followed by recession. However, there are a lot of different moving parts this time. The forward markets are already inverting and there could be a chance we do not see the typical cash warning as well.
It will be interesting to watch.
I agree with your comments Larry the Crocodile.
Obviously each stage of the cycle has similarities with the last corresponding points of the cycle phase but they are also unique in themselves.
This time it’s always different for want of a better explanation. QE and Trump being what is likely to distinguish the next recession from the last. Also, investors are very focused on a recession and stock pullback where the two may not go hand in hand perfectly.
How this plays out will be interesting.
I don’t think I paid attention to the ‘noise’ before 2008 and definitely not during the previous recessions – was this talked about during the other downturns? If not, is the very fact that it is on everyone’s radar indicative that this time “things may be different?”
Thank you for the GREAT explanation of yield curves
Why do you fear a bear market in stocks, bonds or any exchange traded vehicle?
I read once that 90% of professional traders are short 90% of the time. The short side is where you can make quick money. Further more – Most investors could fully hedge their entire portfolios with one or two futures contracts using very little money, less than $10,000 -and thus saving themselves from having to gyrate and unwind all their great investments. Don’t sell any investment!!! Hedge it with Futures contracts or any exchange traded derivative that fits. Seek out a Series3 professional expert in the function of hedging.
1 establish a Futures Account
2 put in $10,000
3 wait for the bear market
4 get your Series3 Broker to help you with your fully stated hedging plan
5 keep all your investments in tact if they are good investments
Wow Sam. Thanks for shedding some light on this. Makes perfect sense how you explain it. It is sad to see this amazing bull run on its last legs if this is indeed the case.
Appreciate the heads up.
I enjoyed the article, but it left me with some questions that you did not answer. Hence, I went and did some research on my own to answer them.
Q. Is there any data that contradicts your assertion that an inverted yield curve leads to a recession within two years?
A. Yes. Japan has had five recessions without an inverted yield curve in the past three decades.
Q. Can the curve invert, and there not be a recession?
A. Yes. Australia has had four yield curve inversions and only one recession.
Q. But we are talking about the United States, and not Japan or Australia. What about in the United States, does an inverted yield curve really predict a recession?
A. Since 1968, an inverted yield curve in the United States has predicted a recession within two years. However, from 1935 to 1965, the United States had six recessions without an inverted yield curve. In those cases, the United States was in a low interest rate environment. Also, in late August and early September of 1966, the United States had a brief inverted yield curve, with no recession. Finally, in late 1998, there was a very flat curve, but no inversion or recession. The yield curve finally inverted in 2000, with a recession in 2001. It also looks like that there may be brief times (on the order of days) when the yield curve inverts before correcting itself. But I need to do more looking into the data for that last point.
Therefore, an inverted yield curve in the United States looks to be a good leading indicator of a recession within two years, but it is not a guarantee of a recession. I would also look for other data to corroborate the likelihood of an impending recession.
Again, this was a very good article.
Great research! Thanks for sharing.
Another tenet of investing besides everyone being rational long term, is that there are never any guarantees either. One must think and formulate an economic and investment thesis, and invest accordingly. I don’t want people investing blindly and then waking up shocked things didn’t work out they way it did.
The more FS readers can get educated, including myself, the better.
If I knew all the guaranteed returns, I’d have retired early and become a stay at home dad for the first five years because who has kids and then decides to go to work to pay a stranger to take care of their kids?! Now that would be irrational.
Related: To Get Rich, Practice Predicting The Future
Back to me original question: “Is there any data that contradicts your assertion that an inverted yield curve leads to a recession within two years?”
The Too Long; Didn’t Read (TLDR) version is that since 1976, there is no monthly data that contradicts your assertion that an inverted yield curve leads to a recession within two years.
But the longer answer is a little bit more nuanced than that.
I took the 10 year Treasury data and subtracted the 2 year Treasury data since 1976. There is a good correlation between an inverted yield curve and a recession within two years, except for one false positive. That false positive occurred in 1998. As I noted above: “there was a very flat curve, but no inversion or recession”. Technically, the yield curve did invert in 1998, but just barely. On June 25, 1998, the 10 year Treasury was yielding 5.46% while the two year Treasury was yielding 5.53%. That is a minuscule difference of 0.07%. Over the 23 days that it was inverted, that was the largest different while the average of the inversion was 0.03%. You could call it a very flat curve or an inversion, depending on your time scale, and be correct either way.
Compare the 1998 data to 2000, when the curve inverted for 8 months with a maximum difference of 0.52% and an average of 0.27%. That is a much stronger signal.
Compare the 1998 data to December 2005, when we see a weak signal (and the recession started in December 2007). This was followed by a stronger signal in February and March 2006. A third, very strong signal occurred starting in June 2006 and continuing into early 2007.
The takeaway is that if you look on the order of days, and for inversions that are less than 0.1%, then you can find contradictory data. If you look on the order of months and for inversions greater than 0.1%, then the inverted yield curve is a very good predictor.
They way I will look at it is that if the yield curve inverts slightly on the order of days, I will move to a cautionary stance, and look for more data. If the yield curve solidly inverts for months, I will still look for more data (I like data), but I will be on the lookout for a recession.
Finally, this does raise other questions.
1. Is this a good sell signal for stocks? In other words, could I sell my stocks up to 2 years in advance of the recession, then buy them back, and make money?
2. Would I make enough money to make it worth the effort?
3. Or would it have been better to just hold my stocks the duration?
4. IF this is a good sell signal, then what is the corresponding good buy signal?
More questions for me to go answer…
Did I mention that I really liked your article?
It depends on one’s goals and timeline. If I was still aggressively seeking financial independence, I’d just stay as long stocks as comfortably possible until the yield curve inverts and then consider de-risking some, or stop investing in stocks and build as big a cash hoard as possible over the next 18 months now that money market rates are paying a respectable amount, and then if a downturn hits then start legging into the market over a 12-18 month period.
As for me, I’ve already de-risked to 55% stocks / 45% bonds and have started building a short-term CD and short-term bond ladder. I feel I will sleep well with this plan in a bull or bear market, so long as I focus on my income generation. Massive net worth growth since 2010 has significantly lessened my greed.
Everyone is going to be different. Gotta find your own strategy.
Having exposure to commodities will help if we see inflation creep up and really help during a recession. I personally own some bitcoin too because its uncorrelated asset that not only adds diversification but could really outperform in the environment you discussed. Well done Sam!
Thanks for this, Sam! This was super helpful. I’ve read other articles on it before and *kind of* understood it, but the chart and you walking us through why the long term and short term borrowing changes really made it sink in.
You could be a sessional instructor at Haas and get all those health insurance benefits for the family.
Hah, I don’t think I’m qualified to teach despite my Econ degree and MBA. I’m more of a doer, than a teacher. This article took me a long time to write because it was so hard to try and explain in simple terms since finance is so Yin Yang.
Why use one indicator when you can use 10?
1. Commercial and industrial loans at commercial banks: a decline indicates recession in progress (currently these loans are growing).
2. Year-over-year decline in stock prices: Recessions follow quickly (not even close to this happening at present).
3. Reversal in the unemployment rate: rate rises more than a quarter point over three consecutive months means recession has probably begun (not now).
4. Corporate/Treasury yield spread. Yield spread between the lowest investment-grade corporate bonds and 10-year T-Bills above 200 basis points is a bad sign (about 170 right now).
5. Copper prices: below $2.50 per pound means a slowdown (currently about $3.50).
6. Freight Transportation Services Index: downward trend changes lead economic slowdowns by an average of four to five months (this just reached a record high).
7. Declining Australian dollar vs. the U.S. dollar: indicates possible slowing global economy (down a little right now, but at .74 it might be okay).
8. Oil price spike: Prices are up again but is it enough?
9. Unemployment: under 4.5% can indicated a recession in 3 years (so around Summer 2020).
10. Inverted yield curve: When long-term rates fall below short-term rates (possibly as early as Summer 2019).
But, for those who really like uncertainty, keep in mind that all timelines to a recession are accelerated if we have a big trade war.
Timing things presents a problem, obviously. Two percent on a CD doesn’t sound like something you want to do for too long. Inflation eats that up in a heartbeat (and probably more if we really were tracking it).
The question being, what do we do inside our retirement plans where CDs are not an option? Move from stock mutual funds to bond mutual funds? What about funds that are in a closed fund (and an extremely good one) that you won’t be able to get back into again? Is it still worth it to avoid a 20-30% decrease that will likely recover within 2 or 3 years?
Also, bear in mind (pun unintentional) that stocks and bonds can both crash at the same time.
Awesome due diligence! Love it when readers take a step beyond. Laddering into short-term treasury notes (6 month, 1 year) are an option. Gradually raising a bigger cash percentage is an option. And lots more.
Related: How To Make Lots Of Money In The Next Recession
There are others, but these are all somewhat problematic in terms of usefulness to small investors.
Mergers, acquisitions, and buyouts: These tend to peak right at market top. But what good is this? Things are already on their way down when these begin to fall off. You could almost just as well say stock prices tend to peak right at market top.
Inflation: Erodes profits and weakens consumer spending. Also causes the Fed to raise interest rates which is for businesses carrying short-term debt and also is bad for bonds. But how much inflation is too much? When is it time to jump?
Debt: Total debt among non-financial U.S. companies is highest right before a market reversal. This tends to make the companies particularly vulnerable when the economic shock arrives. But this may of much predictive value as we would expect borrowing to increase over a bull market, only to be forcibly curtailed when the correction or recession arrives.
Disproportionate Investment in Growth Stocks: During bull markets, investors are less focused on safety and more focused on profit, so the pour money into the companies that are growing most quickly instead of alternatives like value stocks (stocks that are a bargain price or which pay strong dividends). This over investment into growth stocks peaks just before or just after a market top is reached. The obvious problem with its predictive power is that the market may already be in free fall before you can see that investors are shifting out of growth stocks.
But let’s not lose sight of the big takeaway from all this. The important thing is to be prepared for ups and downs, not to do massive sells or buys whenever one is close or, worse, already in progress.
Peter Lynch managed the Fidelity Magellan Fund from 1977 to 1990, and averaged a 29.2% annual return that more than doubled the S&P 500 index. In “One Up on Wall Street,” he relates how he was playing golf in Scotland when someone brought him word of the crash of ’87. He said his first inclination was to run for a phone. Before he did, he recalled that he had invested soundly and had faith in his selections. He then continued to play his golf game instead.
Regarding trying to time the market he once said: “Far more money has been lost by investors preparing for corrections or trying to anticipate corrections than has been lost in the corrections themselves.”
My favorite Wall Street bull, Tony Dwyer, talks about the yield curve inverting incessantly. He stated, its the single biggest predictor of recession there is. However, after the yield curve inverts the stock market usually has positive returns for the next 12 to 18 months.
With this being said, what can a investor do to protect themselves? The answer for me is nothing. Reason is I’m not smart enough to know if this time is the same or different. Therefore I do the same thing when the market goes up as I do when the market goes down. I continually dollar cost average into index funds. I’ve done this through the dot com crash, the lost decade, the great recession, numerous corrections, the Asian financial crisis, the S@l collapse, the Greek crisis. You get the point.
I have never timed the market, never sold at the highs or the lows. Actually I haver never sold a share in 20 years. This has proven to me to be the best way to build passive wealth over a long period of time.
Thanks, Bill
I wouldn’t count on any lead time for this time around. markets today aren’t what they used to be. the specialists are long gone. Much of the trading is pseudo-liquidity provided by the algos. If the computers detect any real selling by institutions then you better believe they will withdraw the bid and probably go short in a heartbeat.
When the downleg happens it will come out of the blue. There will be no time for humans to react. A black maw will simply open up below markets as bids will disappear. Limit down like that. markets close for a few. Reopen. PPT tries to levitate markets for awhile but fails. Limit circuit breakers tripped again. Then the real fun begins as closed door meeting commence. Trial balloons float of helicopter money, overt monetary transactions, and collateral guarantees. We humans then look into the abyss and realize there is no easy way out of this central bank quagmire.
Goodwillhunting, You could very well be right. You also could very well be wrong. That’s why my strategy works.
I do keep 3 percent of my net worth in my fun stock account. That way I can react to different strategies and scratch the itch that people get when turmoil or “irrational exuberance “ occurs. Over time though this account underperforms my boring dollar cost averaging index account.
I do the best when I ignore what I think, as well as people much smarter than me think and just keep buying and holding.
Thanks, Bill
A lot of wisdom in your words Bill. And it reminds me of the high net worth allocation of those in their 70s+ at 60% stocks.
However, I will say with absolute certainty is this: those that have gotten extraordinarily rich quicker than average have placed outsized bets beyond just an S&P 500 index fund.
So I do recommend investors take some aggressive bets throughout the course of their lifetimes with ~10% of their net worth.
No doubt Sam, I believe that as well. I made my money owning a business. Single best way for a person to strike it rich. Now I’m in in the preservation as well as generational wealth phase of my life. My goal is to pass many millions on to my favorite charity. My hope is that my stock portfolio grows to a point that it continually provides resources for a generation or two.
I’ve definitely taken a lot from this great country. I’d like to give some back.
Thanks, Bill
Love your outlook to this Bill, refreshing. For someone still in the accumulation phase I need to ask some hard questions.
3 data points (recessions) in the 35 year data set. Not very robust statistically. Logic sound, but a receding (slower or non-growing) economy doesnt de facto mean a decline in stock prices. A longer historical look at stock market returns/recessions shows lower average, but not always negative, returns. And again, a limited data set.
Real returns might turn out fine.
The yield curve has inverted prior to the recessions preceding the ones in his sample too, although perhaps if we went back far enough it wouldn’t be the case 100% of the time. That being said, if we had to make our best forecast presumably a method based off this data would yield the best predictions.
Just thinking about the yield curve going negative, I agree that if there is a linear regression inversion will come around 2020 as stated. We do know though, that forecasts are highly unreliable especially when economics and finance is the source of the underlying data. Just look at ’94 at the above graph and how it just bumbled along until the dotcom bubble burst at the end of the century – that 6 years! Pulling out all the stops and going turtle is a bit too risky – I am steadily decreasing my exposure to the stock market systematically but not all at once.
This does not mean that I at all disagree! Knowing that if the inversion is coming, that means longer term interest rates will be lower than short term interest rates, which in my mind, as a real estate investor in metro NY (where prices are more insulated than the rest of the country) is a prime reason to start locking in much lower longer term rates relative where they would be (potentially).
Right now, we are investing in a multifamily property (in contract) that is in between 3 major hospitals and a large State University. Our logic is that regardless of what happens in the economy, people always get sick and need nurses/doctors and/or people will always go to University. I agree with Dean on this one, saying that you have to invest regardless – either in CD’s or otherwise…I guess I just hate opportunity costs and interest rate risks especially with CDs
Recall back in summer of ’16 at Jackson’s Hole the talk was about going negative and large scale asset purchases. They knew the GFC would reassert itself. All the intervention had only forestalled the inevitable debt deflation.
I’m using this pullback in paper gold to scoop up more ounces if anybody is actually selling. I look at my sizable cash allocation and yes, I can get 2% now, but what if they go to negative zone? there was a great chart posted on Twitter showing all the real rates across the globe using official CPI numbers. Even with massaged CPI numbers real rates are negative. Gold should be screaming if real rates are below positive 2%! So, yes, Virginia, the price of gold is manipulated.
Good luck with your multi-family property purchase. I’m doing something similar, but with real estate crowdfunding so I don’t have to do any of the work. So far, I’ve got 18 properties around the country, and it feels awesome not to have to do a thing.
With short-term CDs, it’s all about cash management. Now is the time to optimize and take advantage. I’m not talking about dumping a majority of one’s net worth in CDs, yet.
Yes, it’s totally about cash management! Yields on savings and money market accounts have jumped as well. Vanguard is offering 2.05 percent on its’ prime money market fund, but I want the FDIC to guarantee my investment. Sallie Mae’s money market accounts are at 1.9 percent now. I won’t look at less than 2.5 percent on a one year CD. If you want to go through the hassles of membership, Andrews Credit union is offering 2.75 percent on a 9 month CD. Short term treasury paper is attractive as well. No state income tax on the income, which is a bonus in the high tax states like California.
We know the stuff will hit the fan at some point in the not too distant future. You can get 2.8 percent on a two year CD, but my guess is that the rate will climb in the near term. I will only put a small amount out at that yield.
I’m looking forward to buying real estate in about 5 years. Should be on sale around then. In the meantime, I sold a couple of properties and paid off several mortgages. Rents are up and I have been using the proceeds of the sales and the increased cash flow to pay off debt and store up cash for the coming asset sale. Insulation is very important when winter comes…
Timely article as this has been discussed a lot more recently including some comments by Jerome Powell. I’ve personally always wondered if maybe the Fed should be doing more to prevent economic recessions like in this case putting the plan to raise short-term rates on hold, or in the case of the 2008 financial crisis, cutting short-term rates a lot sooner.
Thanks for a very clear and understandable explanation, FS! My interest is as an ‘Investor’, and I follow CD rates as a proxy for the bond examples. Putting the yield curve into practice, nine months ago I bought a 2-year CD at a 1.8% yield. Today, that 2-year CD yields 2.8%.
You are still killing it, you are becoming the Cal Ripken, Jr. of PF bloggers!;-) Continued success to you and all Samurais!
Funny you should mention a short term CD, because I just dropped some coin in a 12-month CIT Bank CD yielding 2.5%.
It feels so good to actually make a return on cash now! My upcoming post will be about building a CD ladder. No brainer to take advantage now.
Why quit when you can keep on going? CR Junior out!
Yes, just posted on the ladder. I would agree that there will be better opportunities coming up. Personally with my time horizon I will capitalize with real estate. Those CD ladders will be coming due when it is time to pick up a multi family. As far as stocks go though I am a robot to much volatility to not be. If I “got out” I would be stressed the whole time and would be guessing when to re-enter.
I am just grateful this first bull run allowed me to be in the position I am. I feel like luck and timing are really part of investing.
Here’s to being prepared in 2020!
Looking forward to your upcoming post about CD ladder!